
Laravel Pulse is one of the most helpful health and performance monitoring tools designed to help Laravel developers automate all the monitoring activities and identify critical issues with the applications before they impact the users. This open-source tool ensures applications run smoothly and is extremely helpful in maintaining a high-quality user experience and operational reliability.
In this article, we’ll take a look at the standout Laravel Pulse features and guide you through the step-by-step installation process. So, let’s get right in!
Laravel Pulse: What Are The Key Features?
Application Usage
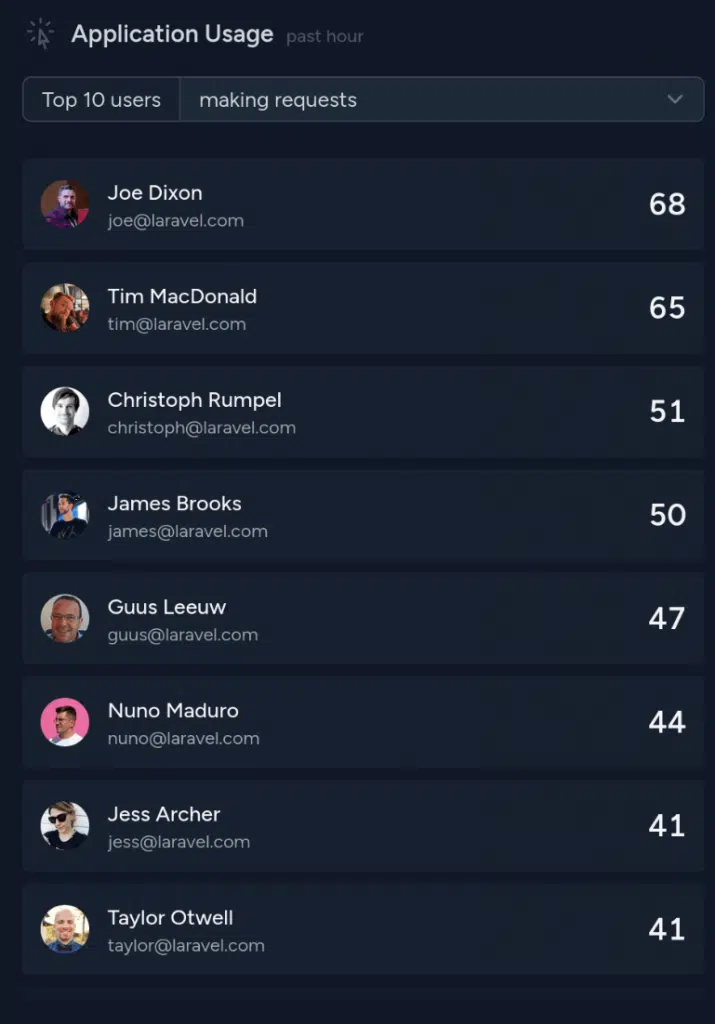
This feature gives you the possibility to find users who make the most requests, have issues with the slowest endpoints and dispatch the most jobs in the application. That way, you can have a great overview of who overloads applications the most.
Slow Routes
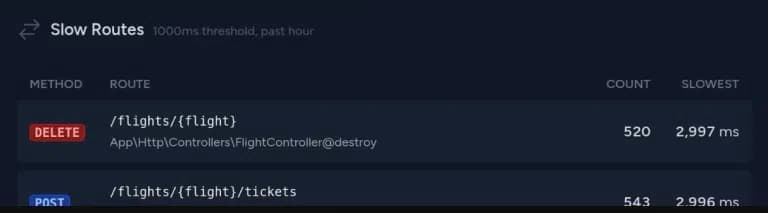
Slow Routes helps you find route endpoints that take a lot of time to return a response with the route name and action method. It provides valuable insights for developers to optimize their performance.
Slow Jobs
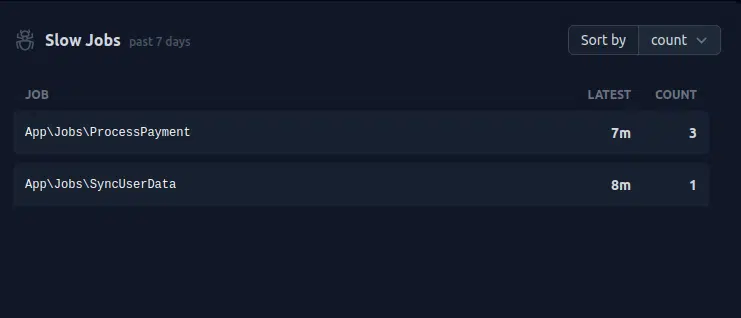
Just like with routes, Laravel Pulse offers you the chance to locate jobs, which usually take the most processing time. You’ll also find a dedicated column to track the frequency of job failures.
Slow Queries
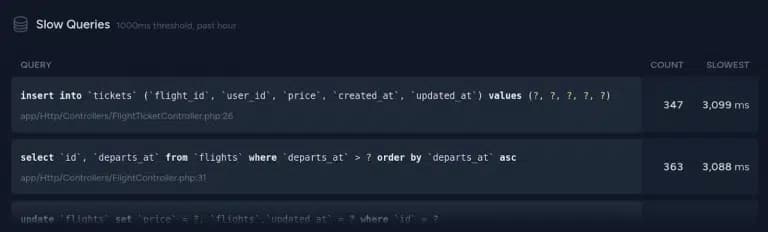
This section gives you the opportunity to find queries over a threshold. It displays raw SQL commands without bindings. You can check identical queries aggregates in one result and show the file location where it was executed.
Exceptions
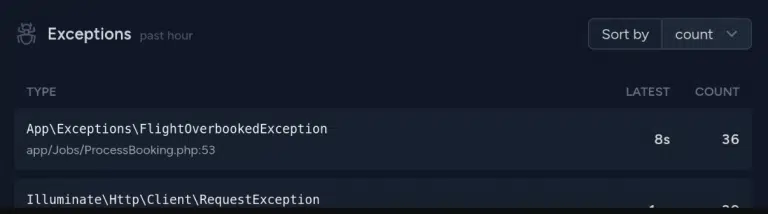
This feature keeps track of all the exceptions thrown in the application. It helps you identify the type and frequency of exceptions, as well as when the most recent one occurred.
Requests
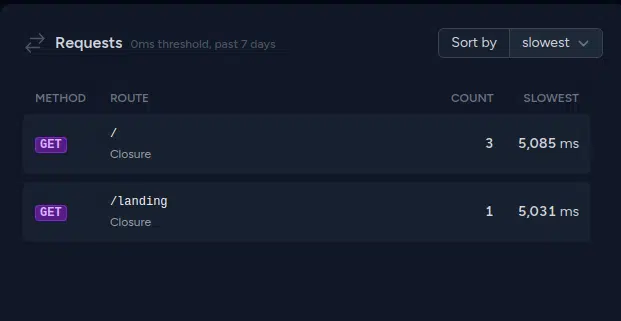
Laravel Pulse tracks all HTTP requests and provides information on the frequency of endpoint calls and their execution times.
Server Stats
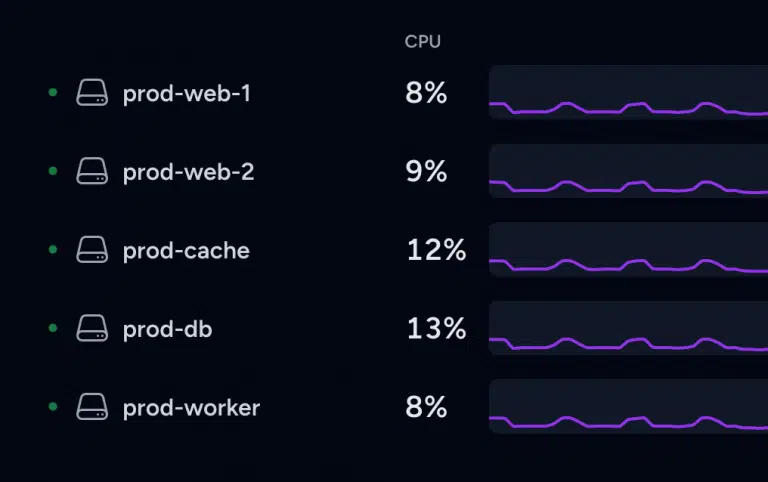
In this section, we can check CPU, disk and memory usage. Even if we are using several servers, you can still monitor it in one place.
Laravel Pulse: Installation Process
Laravel Pulse is now stable (currently v1.7.x) and MIT-licensed, with over 15 million Composer installs, no beta flags needed. Just install it directly into your Laravel project:
composer require laravel/pulseThen, you should publish the Pulse configuration and migration files using the Artisan command:
php artisan vendor:publish --provider="Laravel\Pulse\PulseServiceProvider"And finally, you should run the migrate command in order to create the tables needed to store Pulse’s data:
php artisan migrateOnce Pulse’s database migrations have been run, you can access the Pulse dashboard via the /pulse route.
Most Pulse recorders will automatically capture entries based on framework events dispatched by Laravel. However, the servers recorder and some third-party cards must poll for information regularly. To use these cards, you should run the pulse:check daemon on all of your individual application servers:
php artisan pulse:checkThe Pulse dashboard can be accessed via the /pulse route. By default, you will only be able to access this dashboard in the local environment, so you will need to configure authorization for your production environments by customizing the ‘viewPulse’ authorization gate. You can accomplish this within your application’s app/Providers/AppServiceProvider.php file:
use App\Models\User;
use Illuminate\Support\Facades\Gate;

/**
* Register any authentication / authorization services.
*/
public function boot(): void
{
   Gate::define('viewPulse', function (User $user) {
       return $user->isAdmin();
   });

   // ...
}
The Laravel community is also actively engaged in creating custom cards to make the dashboard even more user-friendly.
Laravel Pulse vs. Telescope vs. Nightwatch
Laravel now offers three different tools for keeping an eye on your application, and it's easy to get confused by them. So, here's a quick breakdown of how they differ from each other:
| Telescope | Pulse | Nightwatch | |
| What it's for | Local, per-request debugging | Aggregated production monitoring | Hosted production observability |
| Where it runs | Self-hosted, in your app | Self-hosted, in your app | Managed SaaS (Laravel-hosted) |
| Data granularity | Every individual query, job, and exception | Rolled-up averages, counts, and maxes | Agent-collected, sent off-process |
| Cost | Free, MIT-licensed | Free, MIT-licensed | Paid subscription |
| Storage | Your app's database | MySQL, MariaDB, or PostgreSQL | Nightwatch's cloud |
| Best for | "Why did this one request behave that way?" | "Is my app healthy right now, and where are the bottlenecks?" | Production apps that want managed observability without running their own dashboard |
In short: Telescope is for digging into a single request while you're developing locally. Laravel Pulse gives you a lightweight, self-hosted, at-a-glance view of your app's health in production, slow jobs, slow queries, your busiest users, without sending any data off-site.
Laravel Nightwatch is Laravel's own answer for teams that would rather not run and maintain that dashboard themselves; an out-of-process agent ships your app's telemetry to Laravel's hosted platform instead. They're not mutually exclusive; many teams run Telescope locally and Pulse in production, and reach for Nightwatch only when they want observability handled for them.
Laravel Pulse: What Else To Take Into Account?
Laravel developers can maximize application performance and communicate team priorities to team members using the information gathered from monitoring. It’s also essential for developers to keep an eye on the routine Laravel Pulse dashboard in order to stay up to date on application status and avoid missing any key information. Setting up alerting methods, such as connecting Laravel Pulse to email or Slack, is one of the most efficient ways to use it. This will guarantee that team members will respond quickly to possible problems. Laravel Pulse is an excellent tool for reviewing past incidents and refining approaches to related problems.
Frequently Asked Questions
Is Laravel Pulse still in beta?
No. Pulse left beta and became stable back in 2024, and it's now actively maintained at v1.7.x with over 15 million Composer installs.
Does Laravel Pulse work with Laravel 13?
Yes. Pulse supports Laravel 13, along with Laravel 12, and Laravel 11.0.8+ and 10.48.4+ on older versions. It requires PHP 8.1 or higher.
Pulse vs. Nightwatch, which should I use?
It depends on whether you want to self-host. Pulse is free and self-hosted, giving you a lightweight production dashboard with full data control. Nightwatch is Laravel's paid, managed alternative for teams that would rather not run their own monitoring stack. See the comparison above for the full breakdown.